

Quarterly Report with Morph Transitions
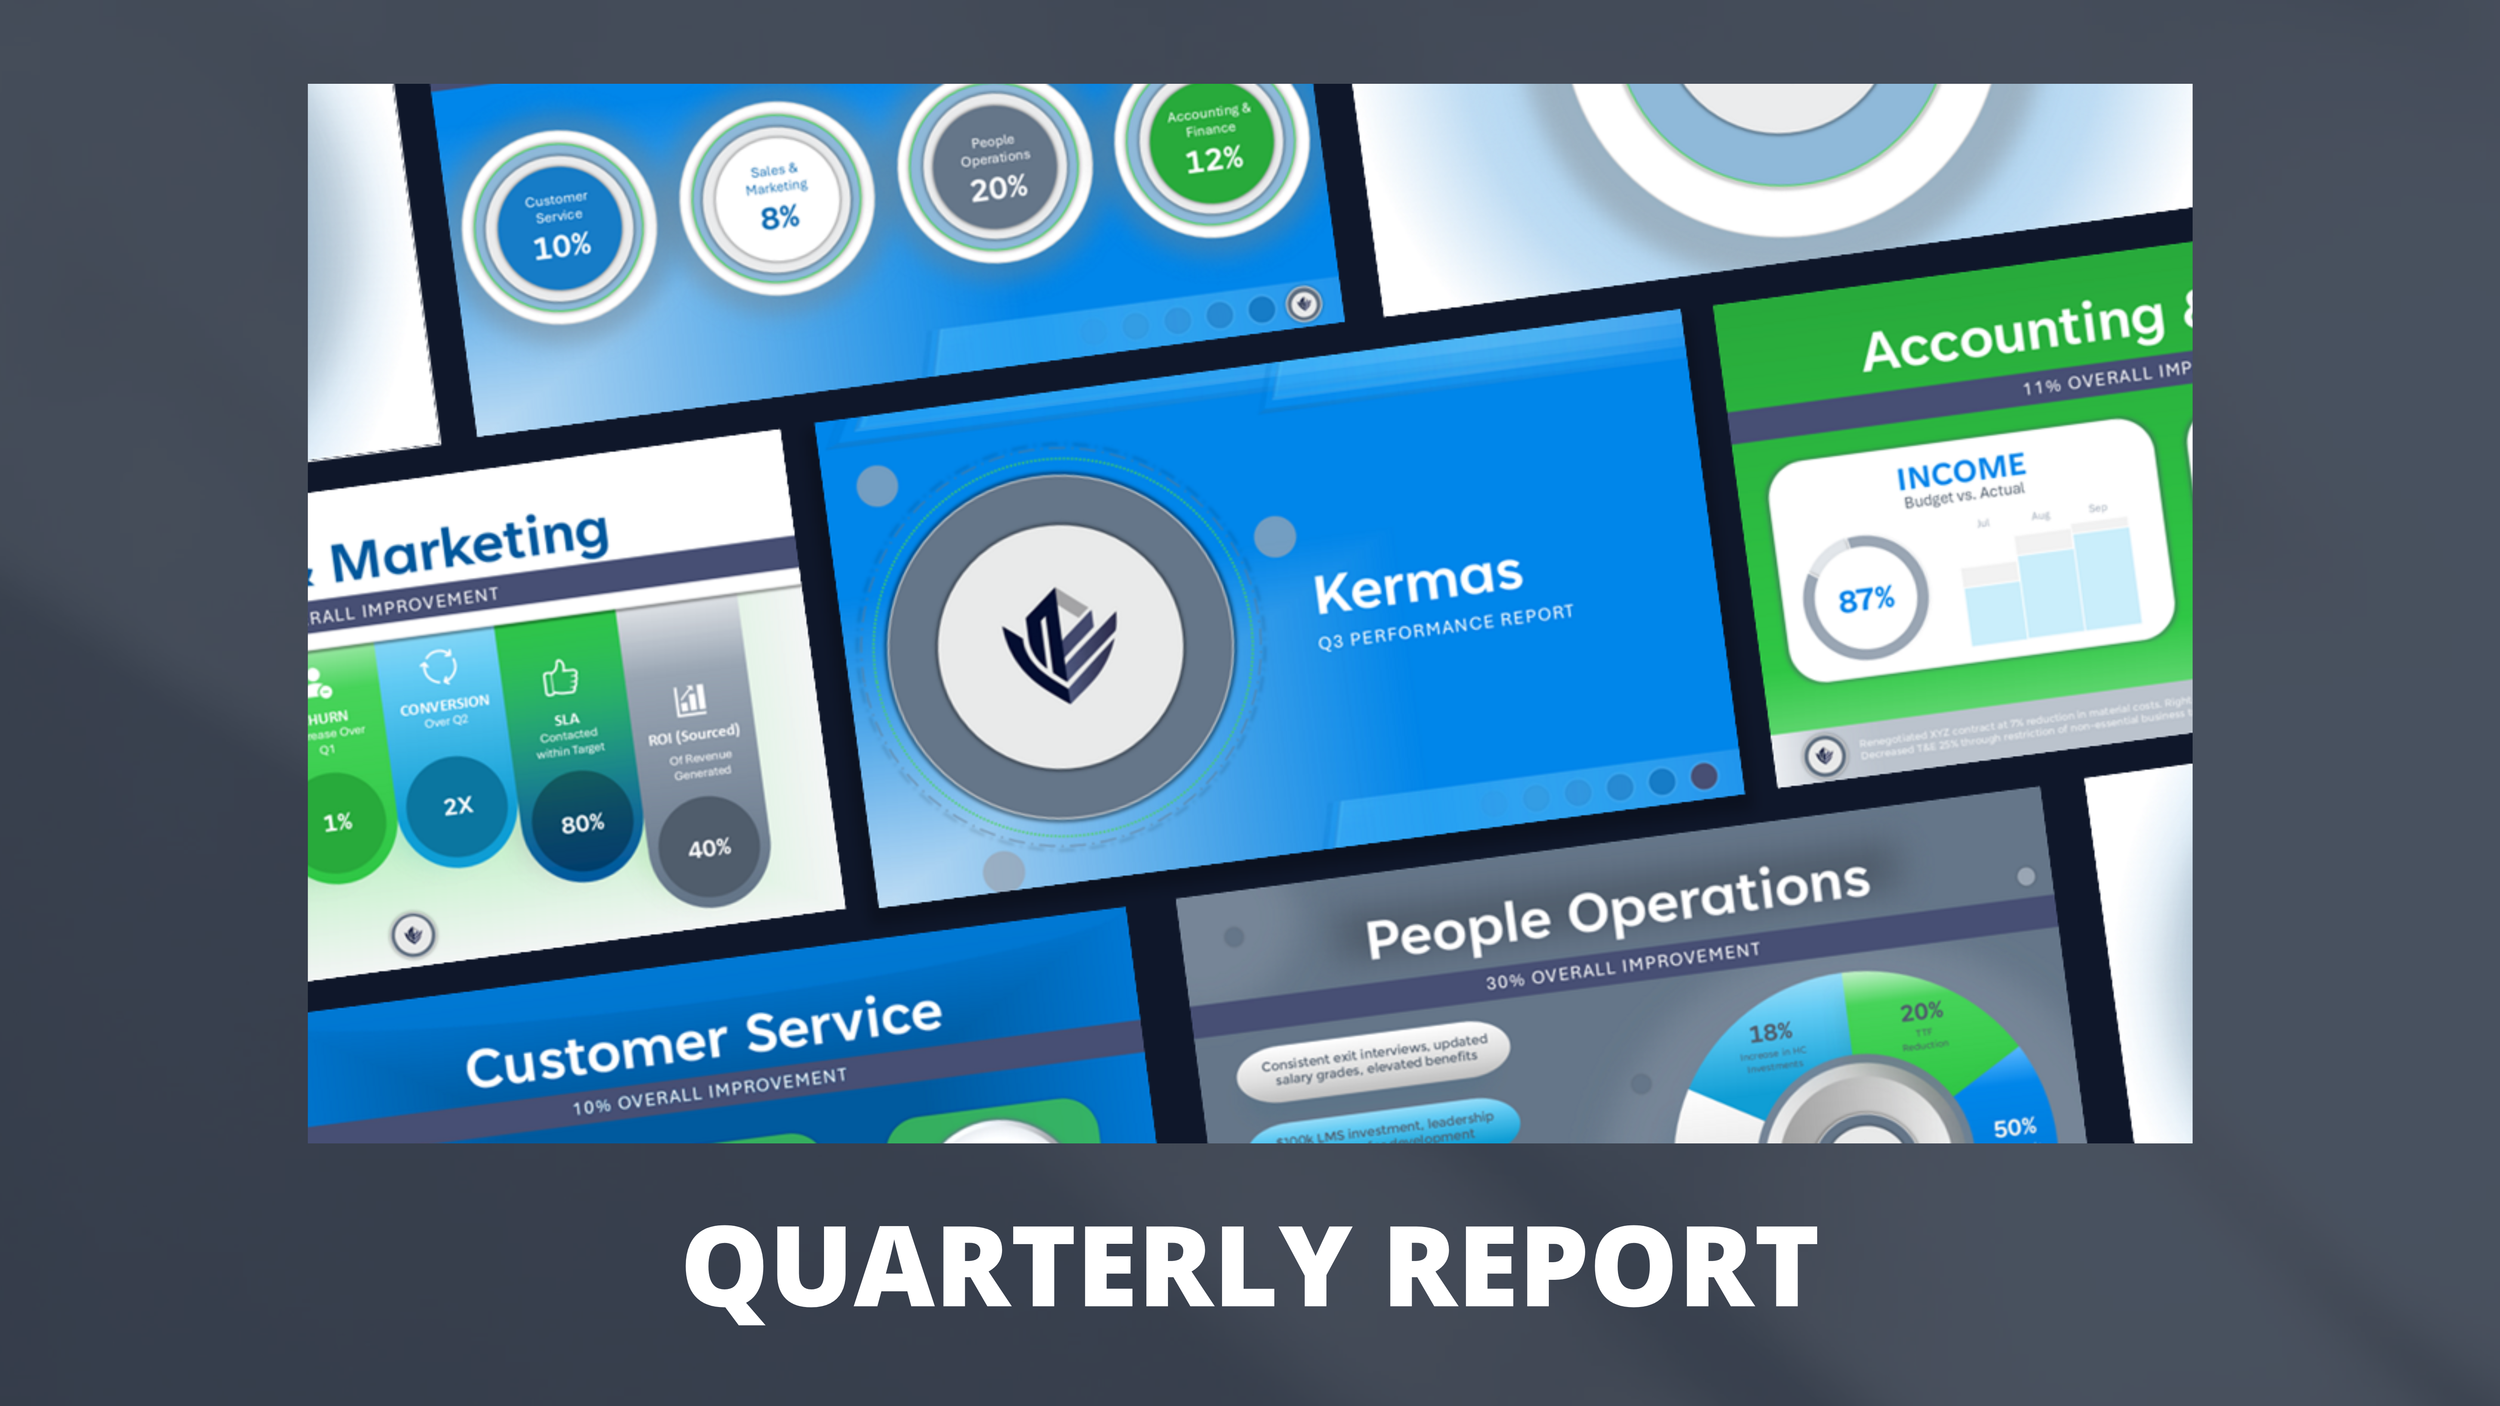
Snapshot
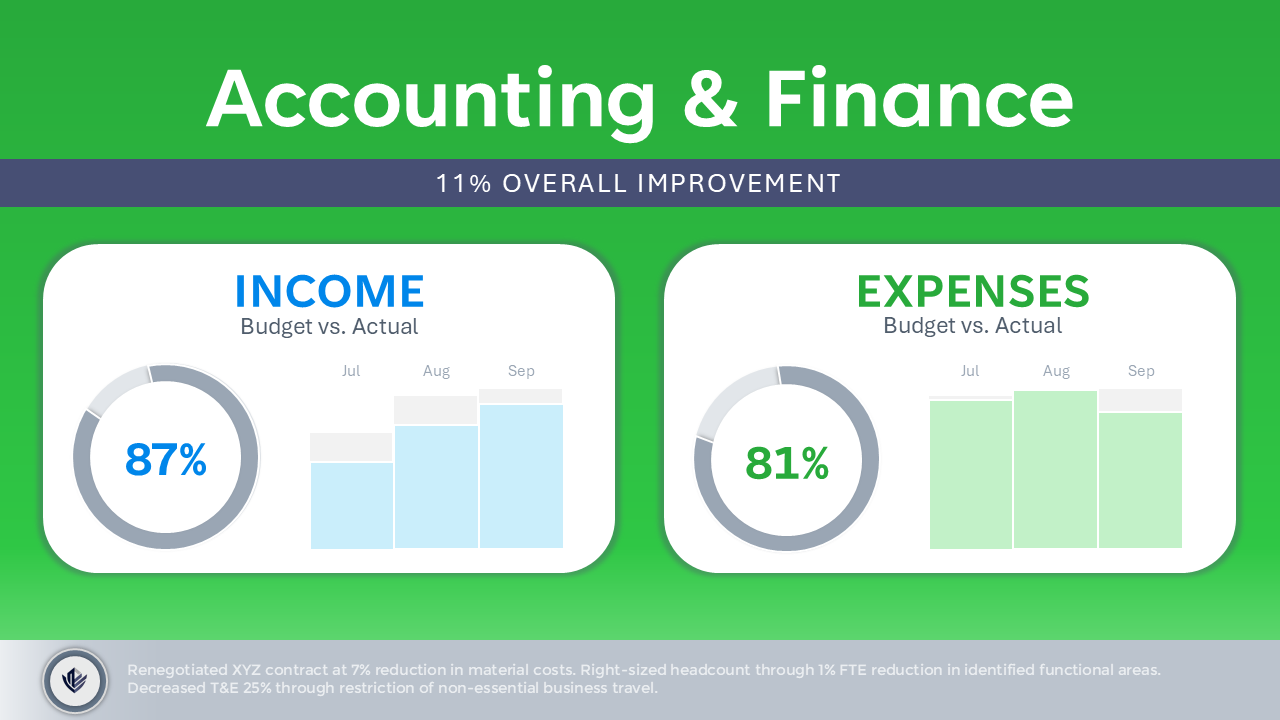
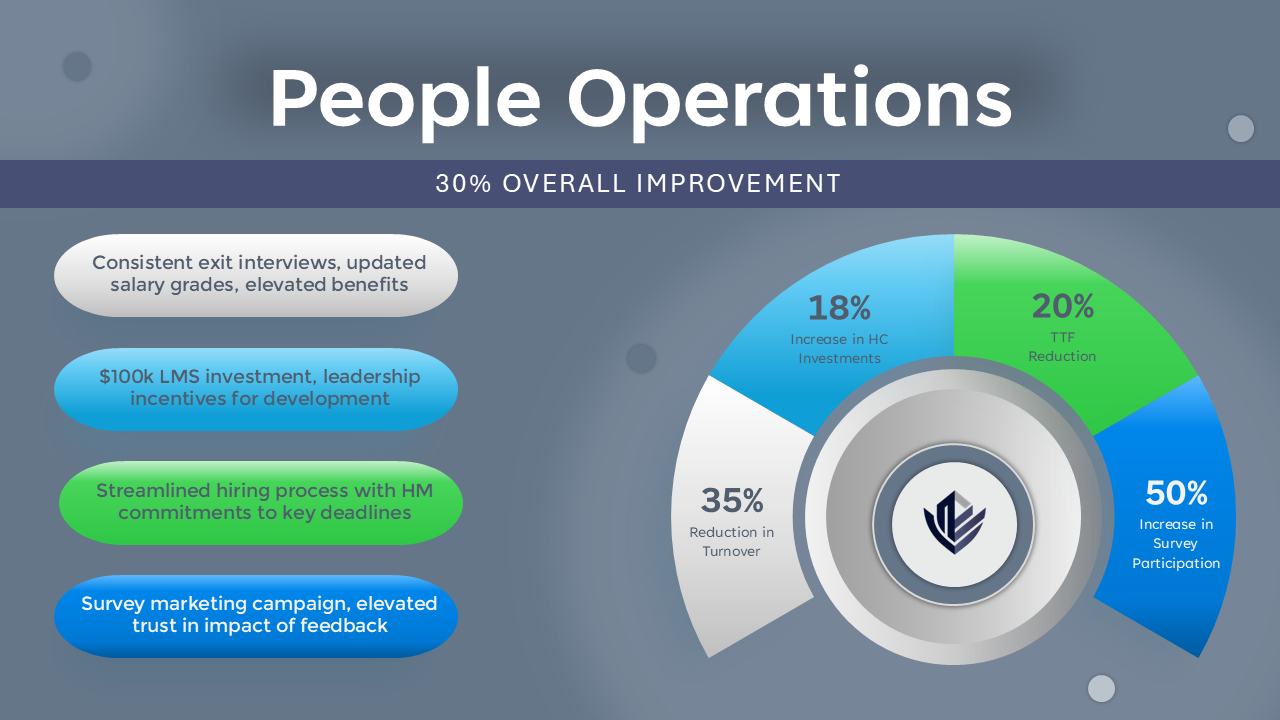
To demonstrate my advanced Morph Transition capabilities, I created this dynamic quarterly report presentation for a mock company (Kermas). Utilizing animated dials, structured dashboards, and smooth morph transitions, this deck transforms dense metrics into an engaging, visual narrative.
Development
To structure this executive report effectively, I synthesized mock multi-departmental metrics into bright, limited text slides that considered the following:
Flow & Morph Architecture: Designed sequential visual transitions that smoothly guide viewers from interesting opening graphics to high-level department summaries and forward-looking targets.

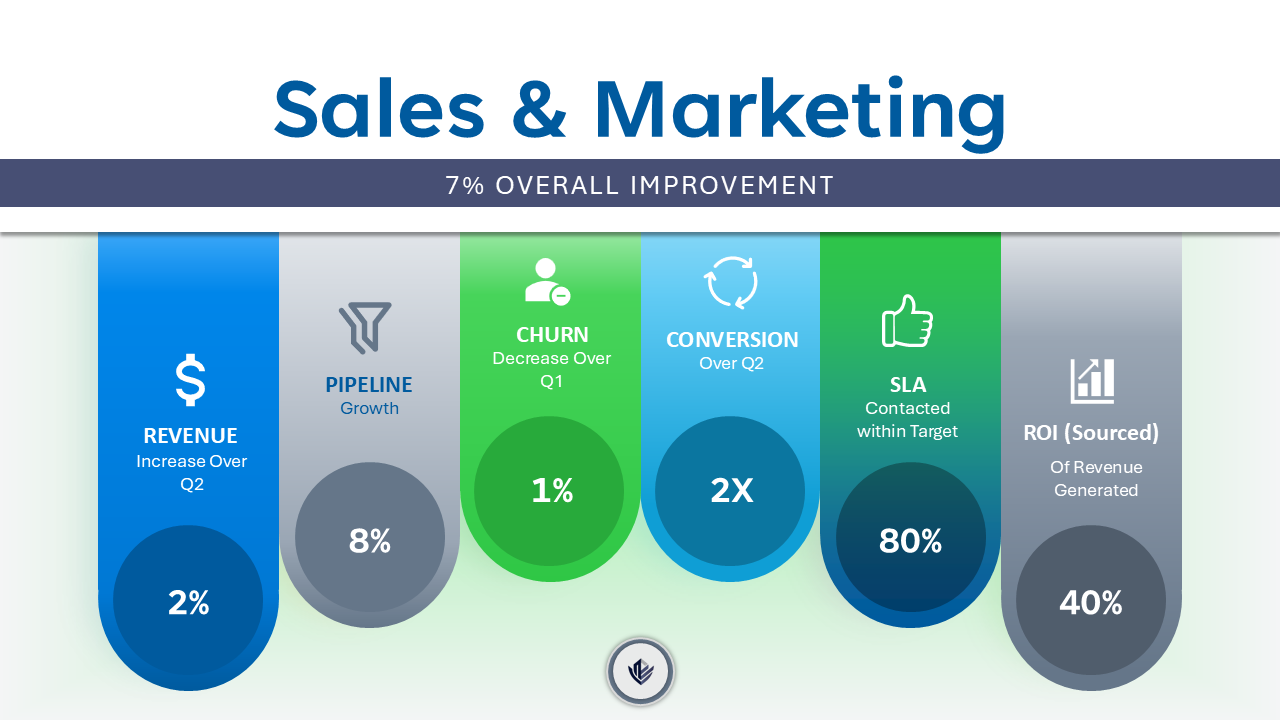
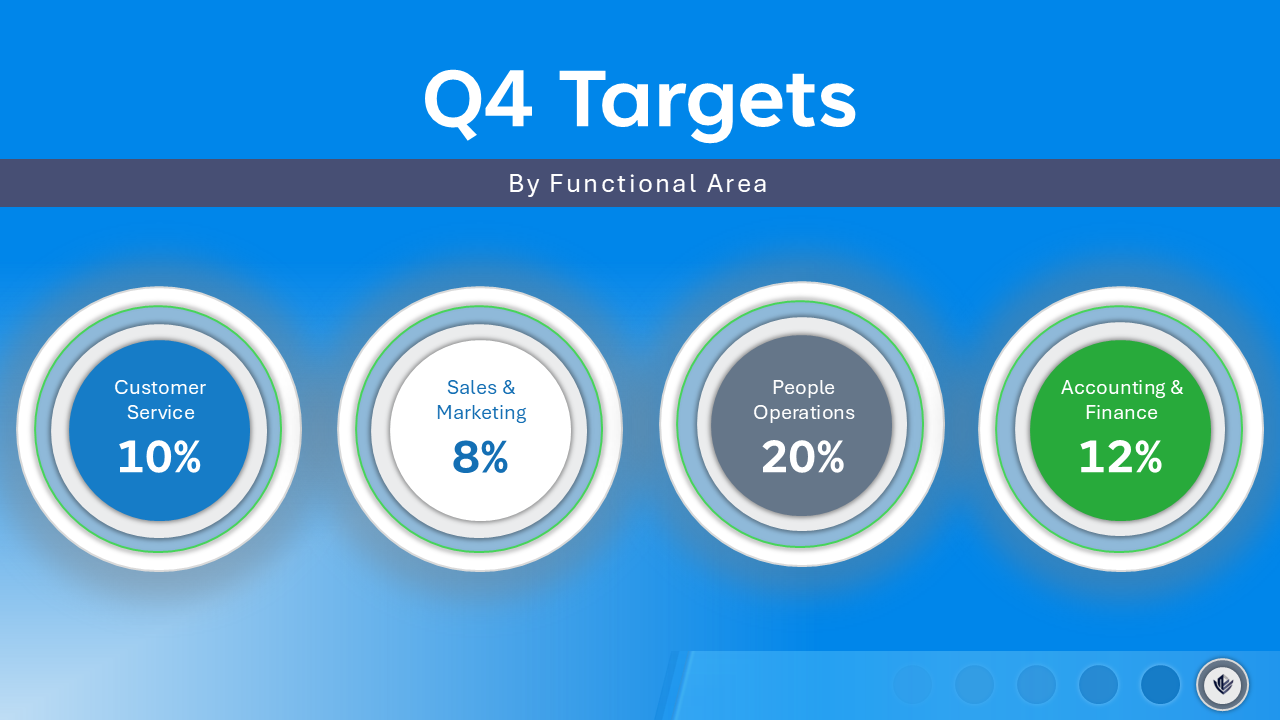
Audience Alignment: Busy professionals need to grasp financial and operational indicators at a glance, without getting lost in text-heavy visuals or an off-topic theme.
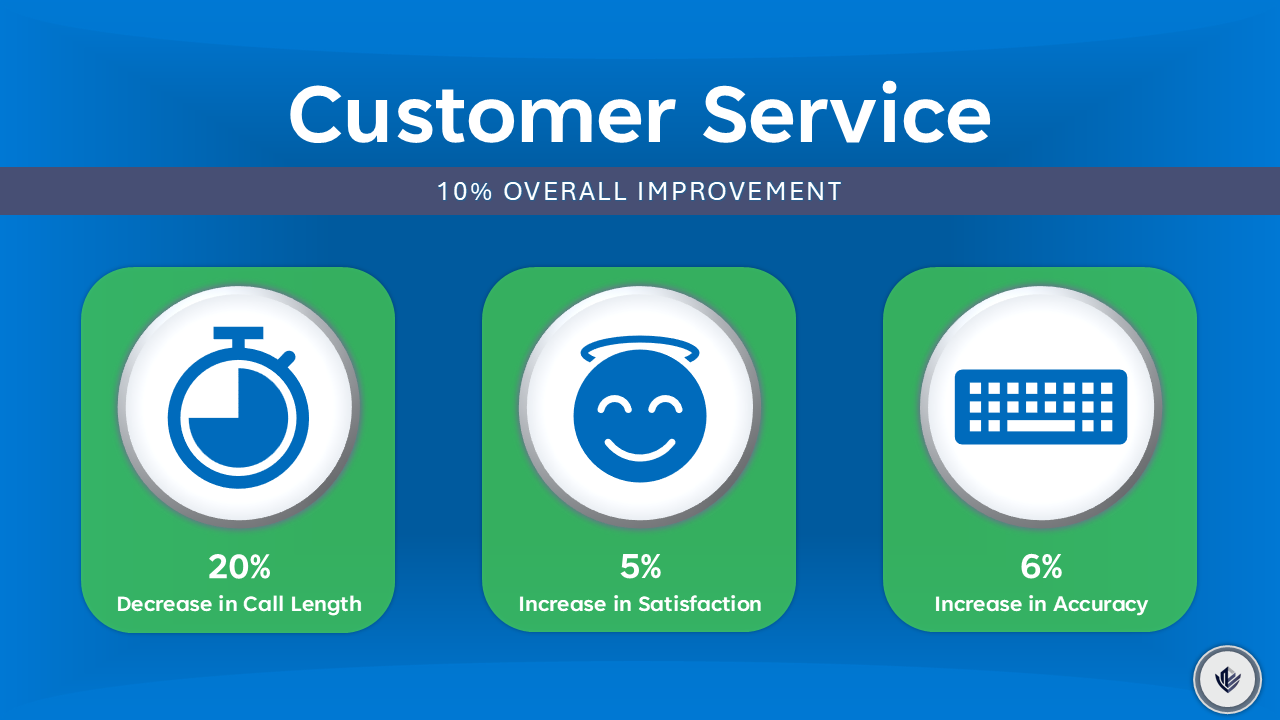
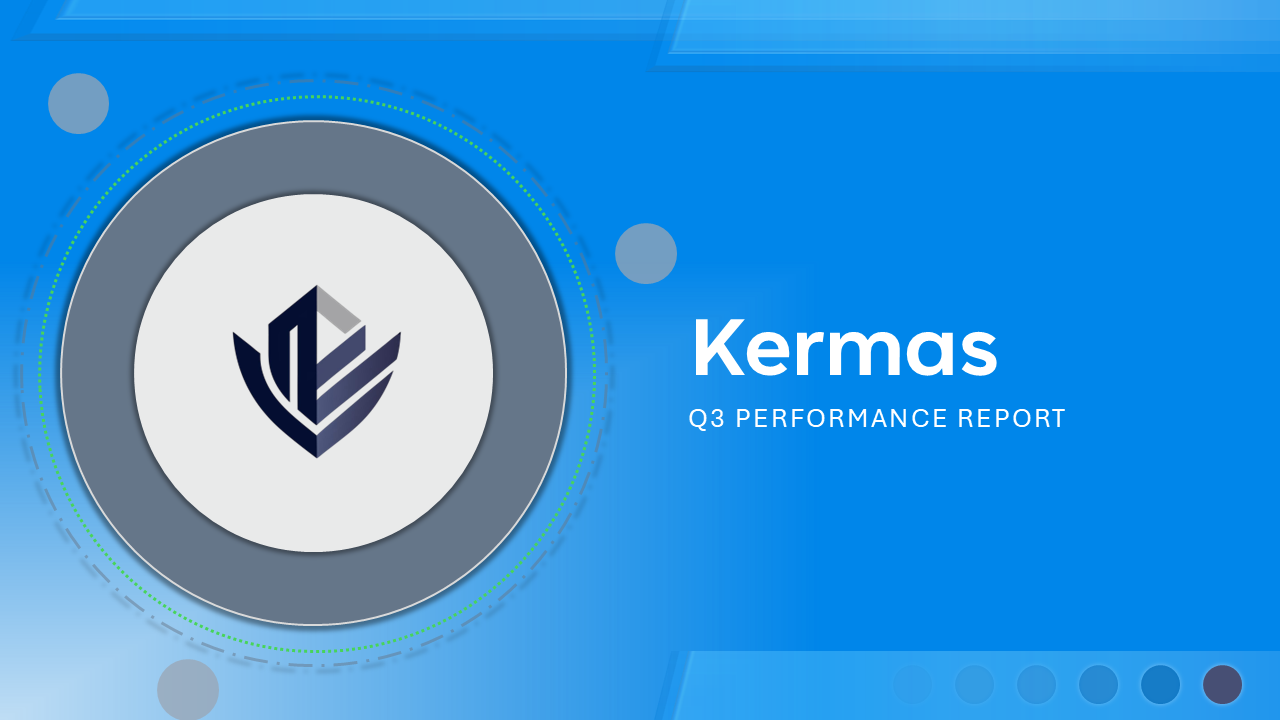
Visual Hierarchy: Clean typography with intuitive data visualizations, including circular completion rings, bar charts, and metric callouts — maximizing data retention and engagement.
Skills Used
Generative AI
Magnific (Freepik) AI
Modern Design Trends
Typography
Visual Hierarchy
Custom Layouts
Rapid Development
Image Editing
Animations
Transitions